APKPure Appを使用する
Electricity Mapsの旧いバージョンをダウンロードすることが可能
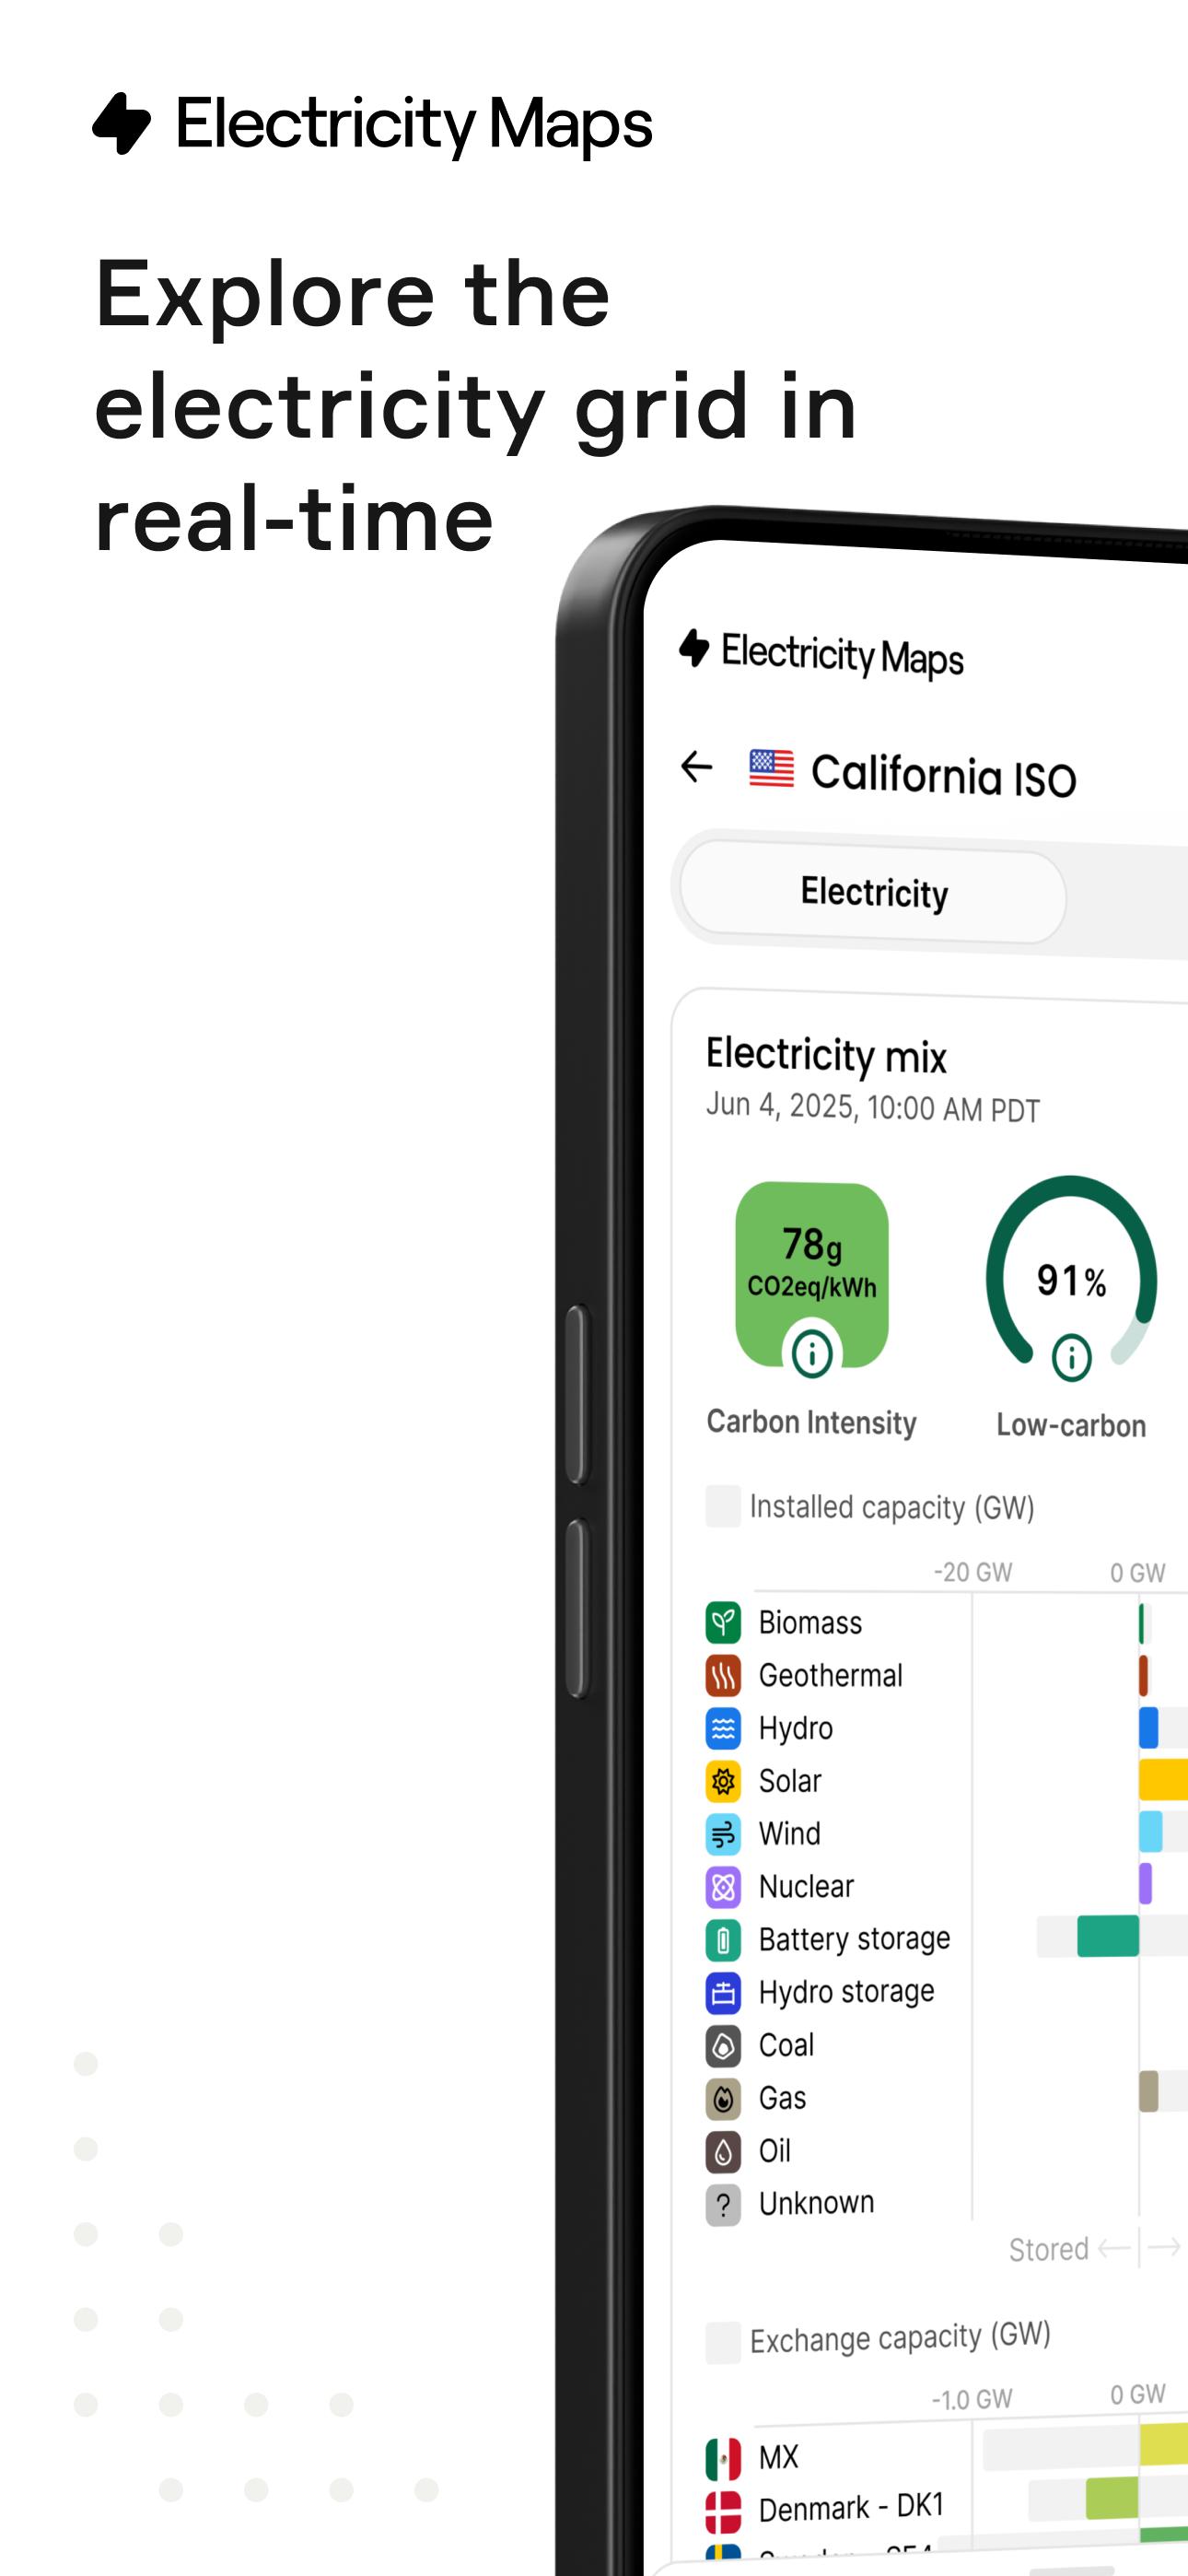
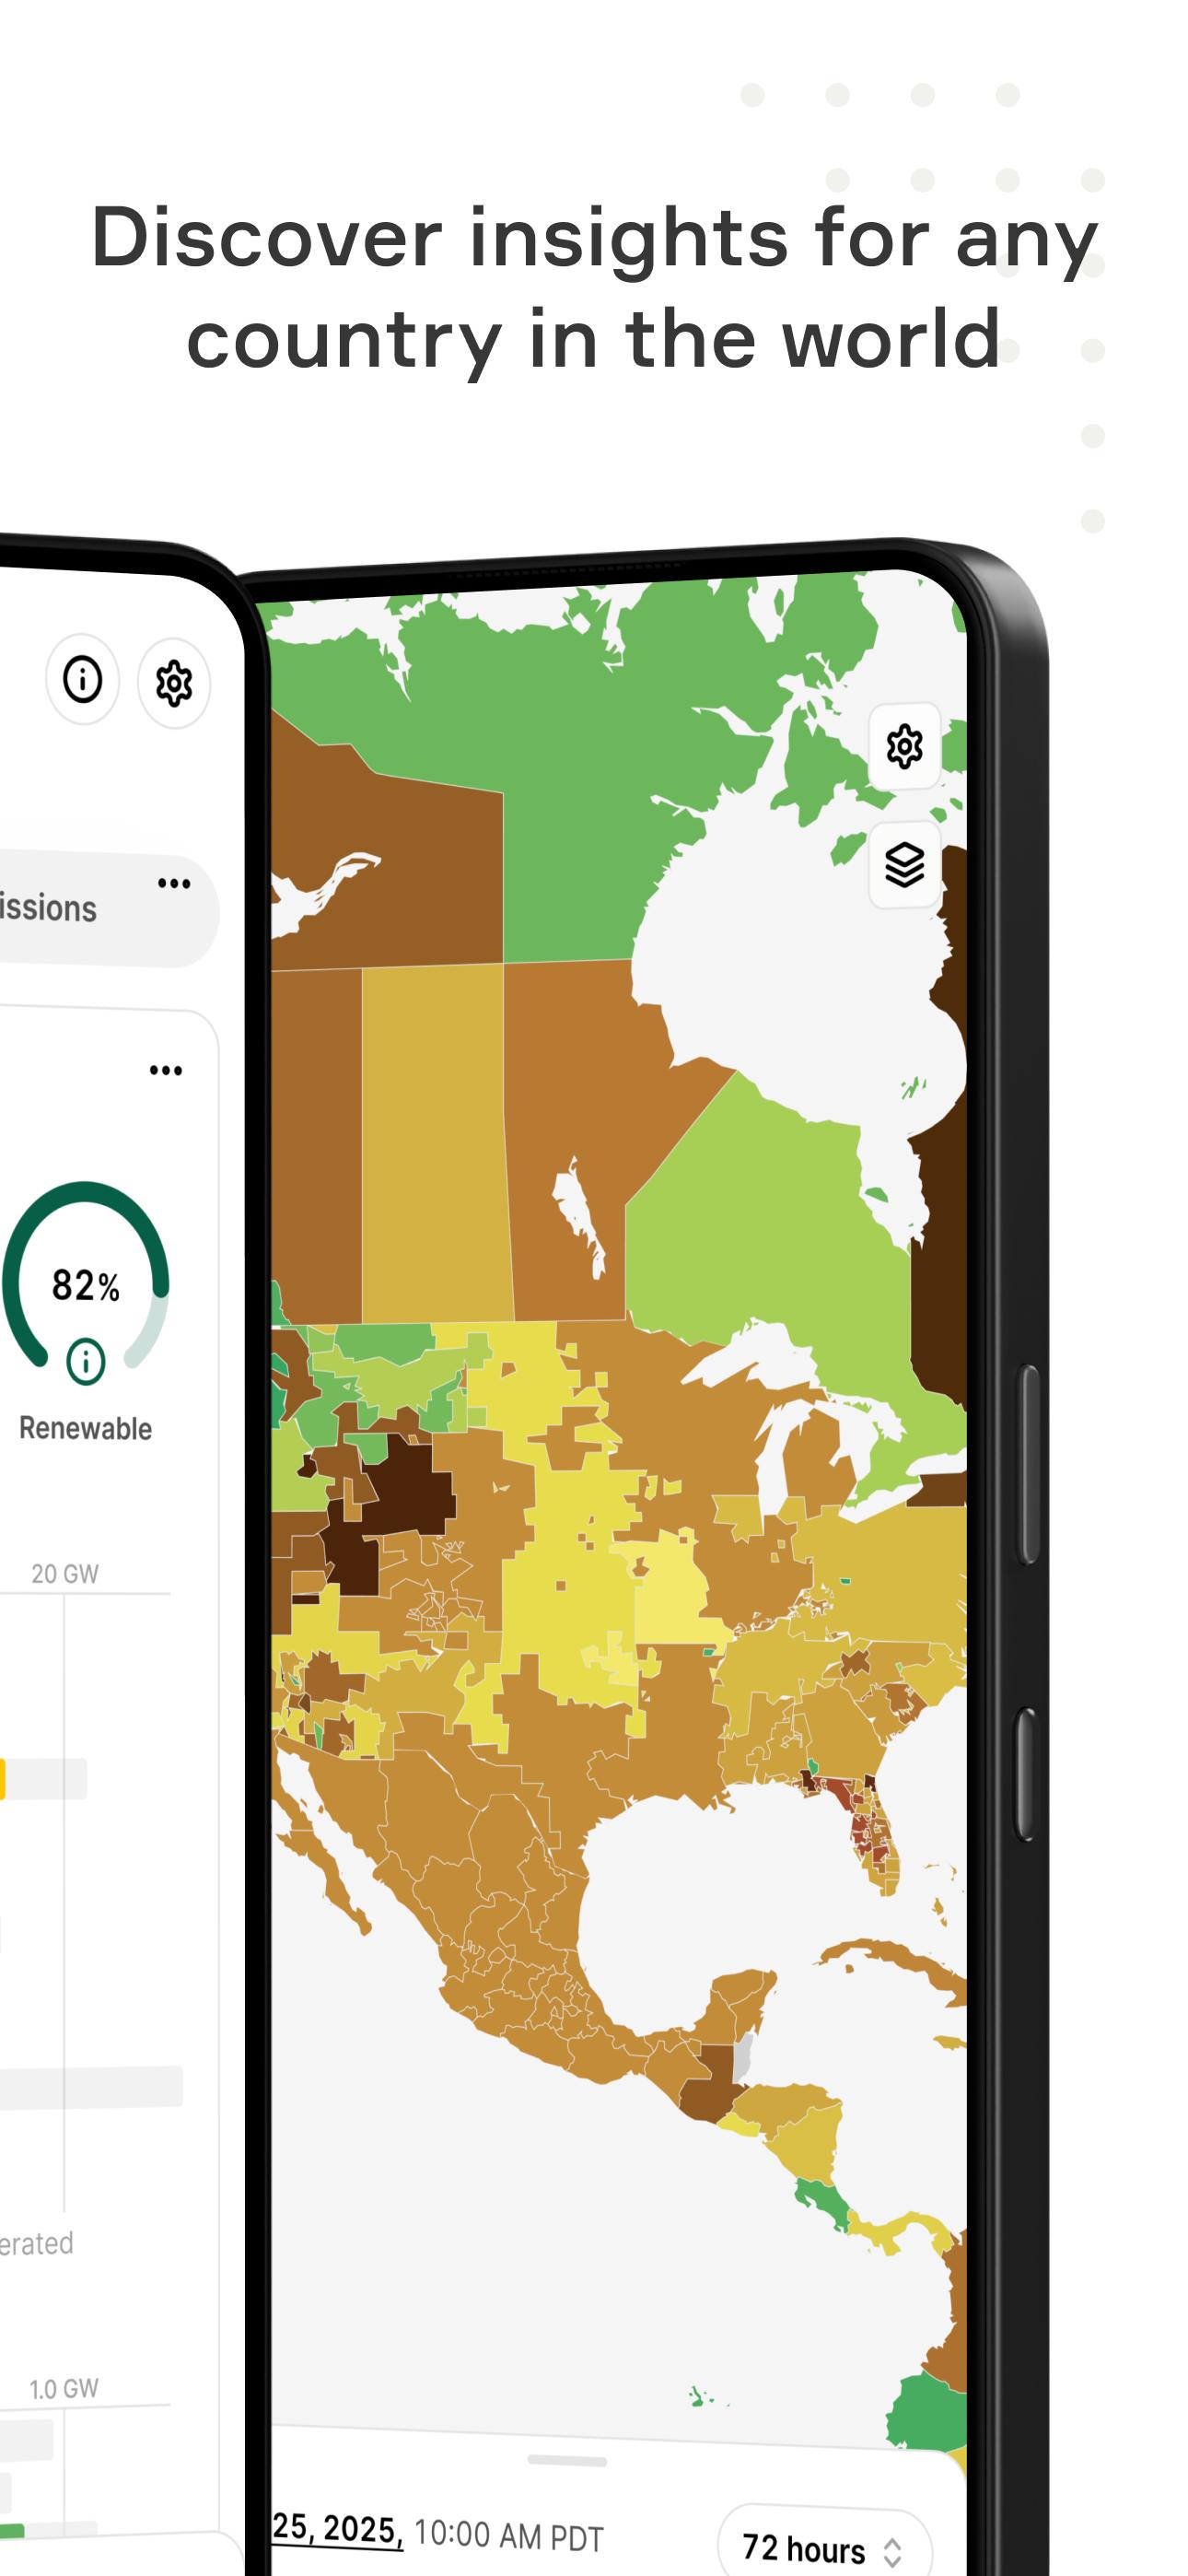
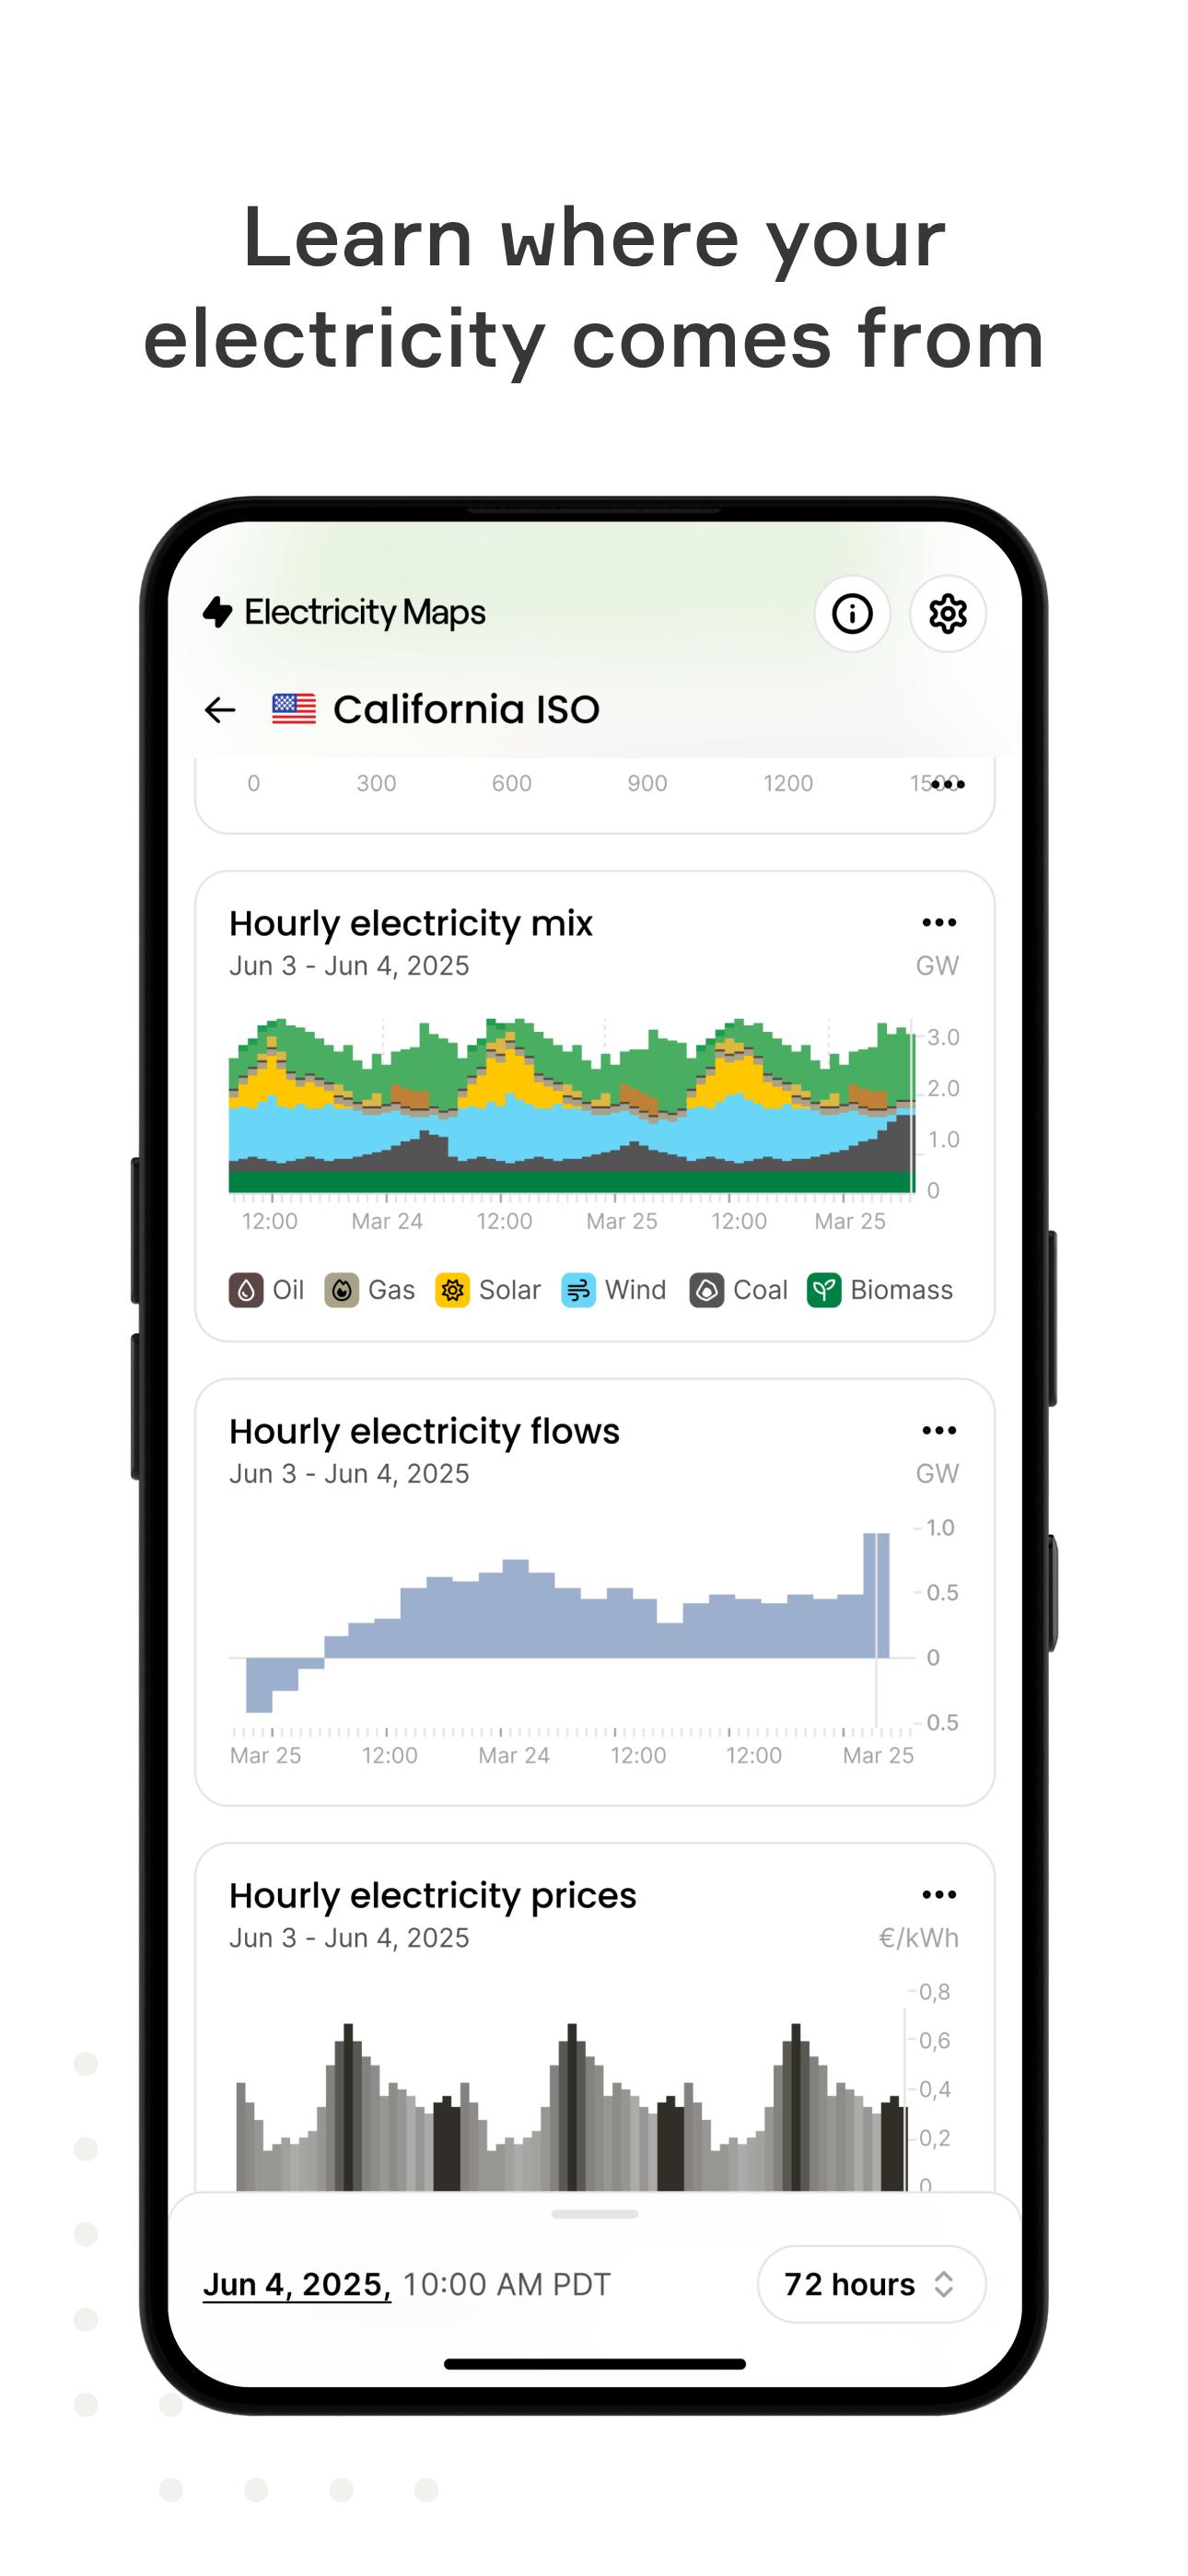
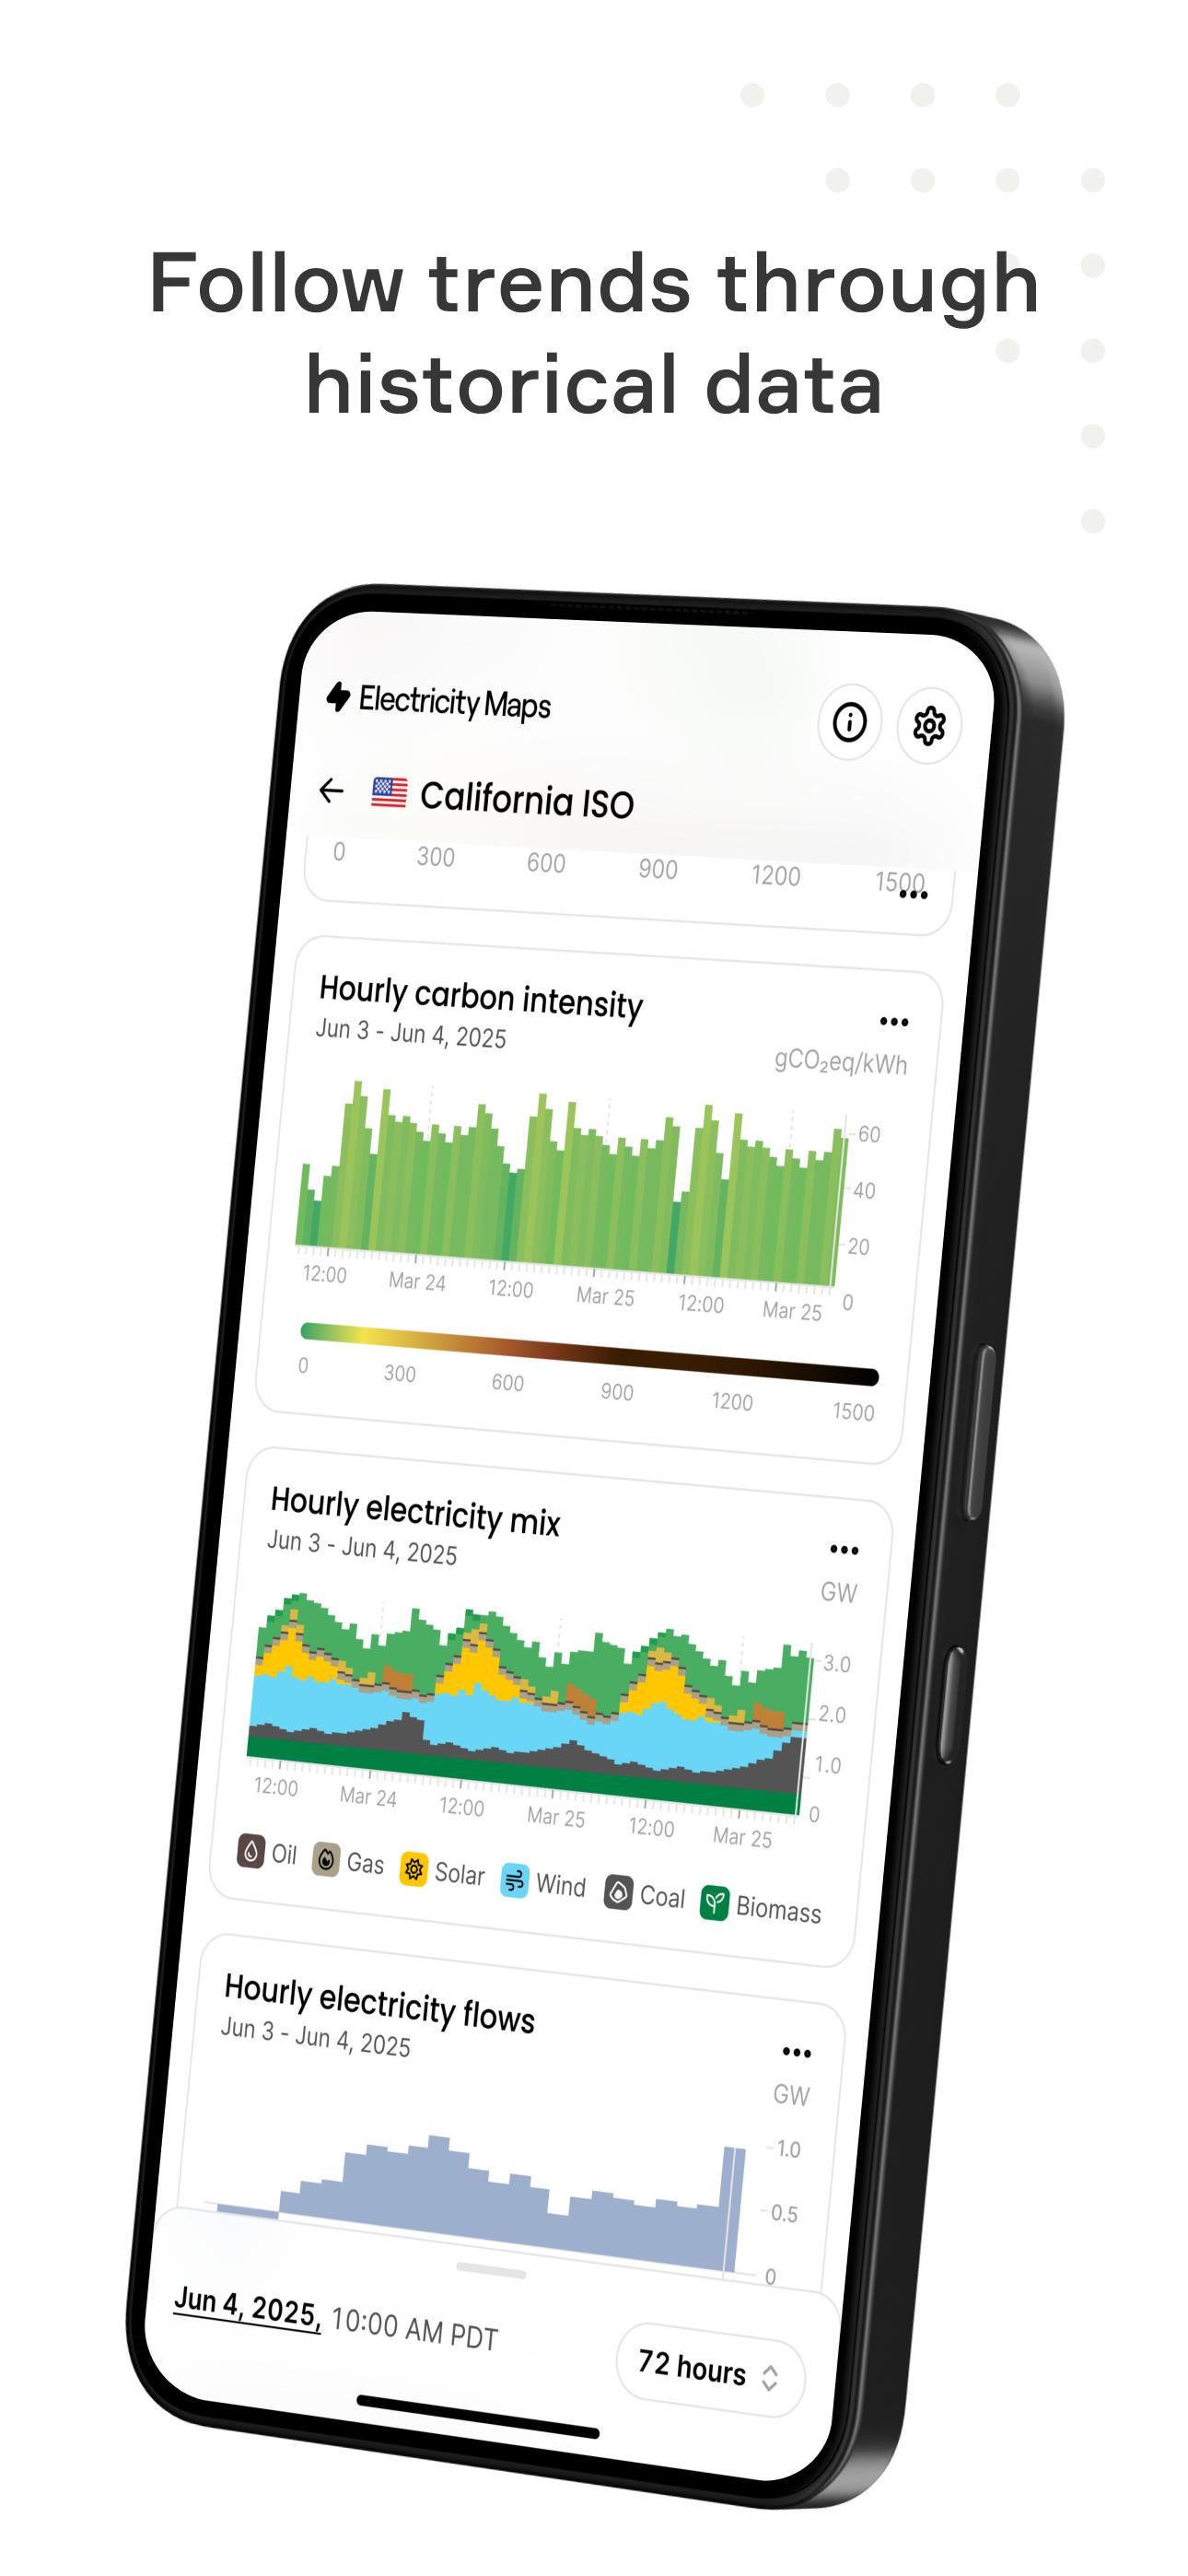
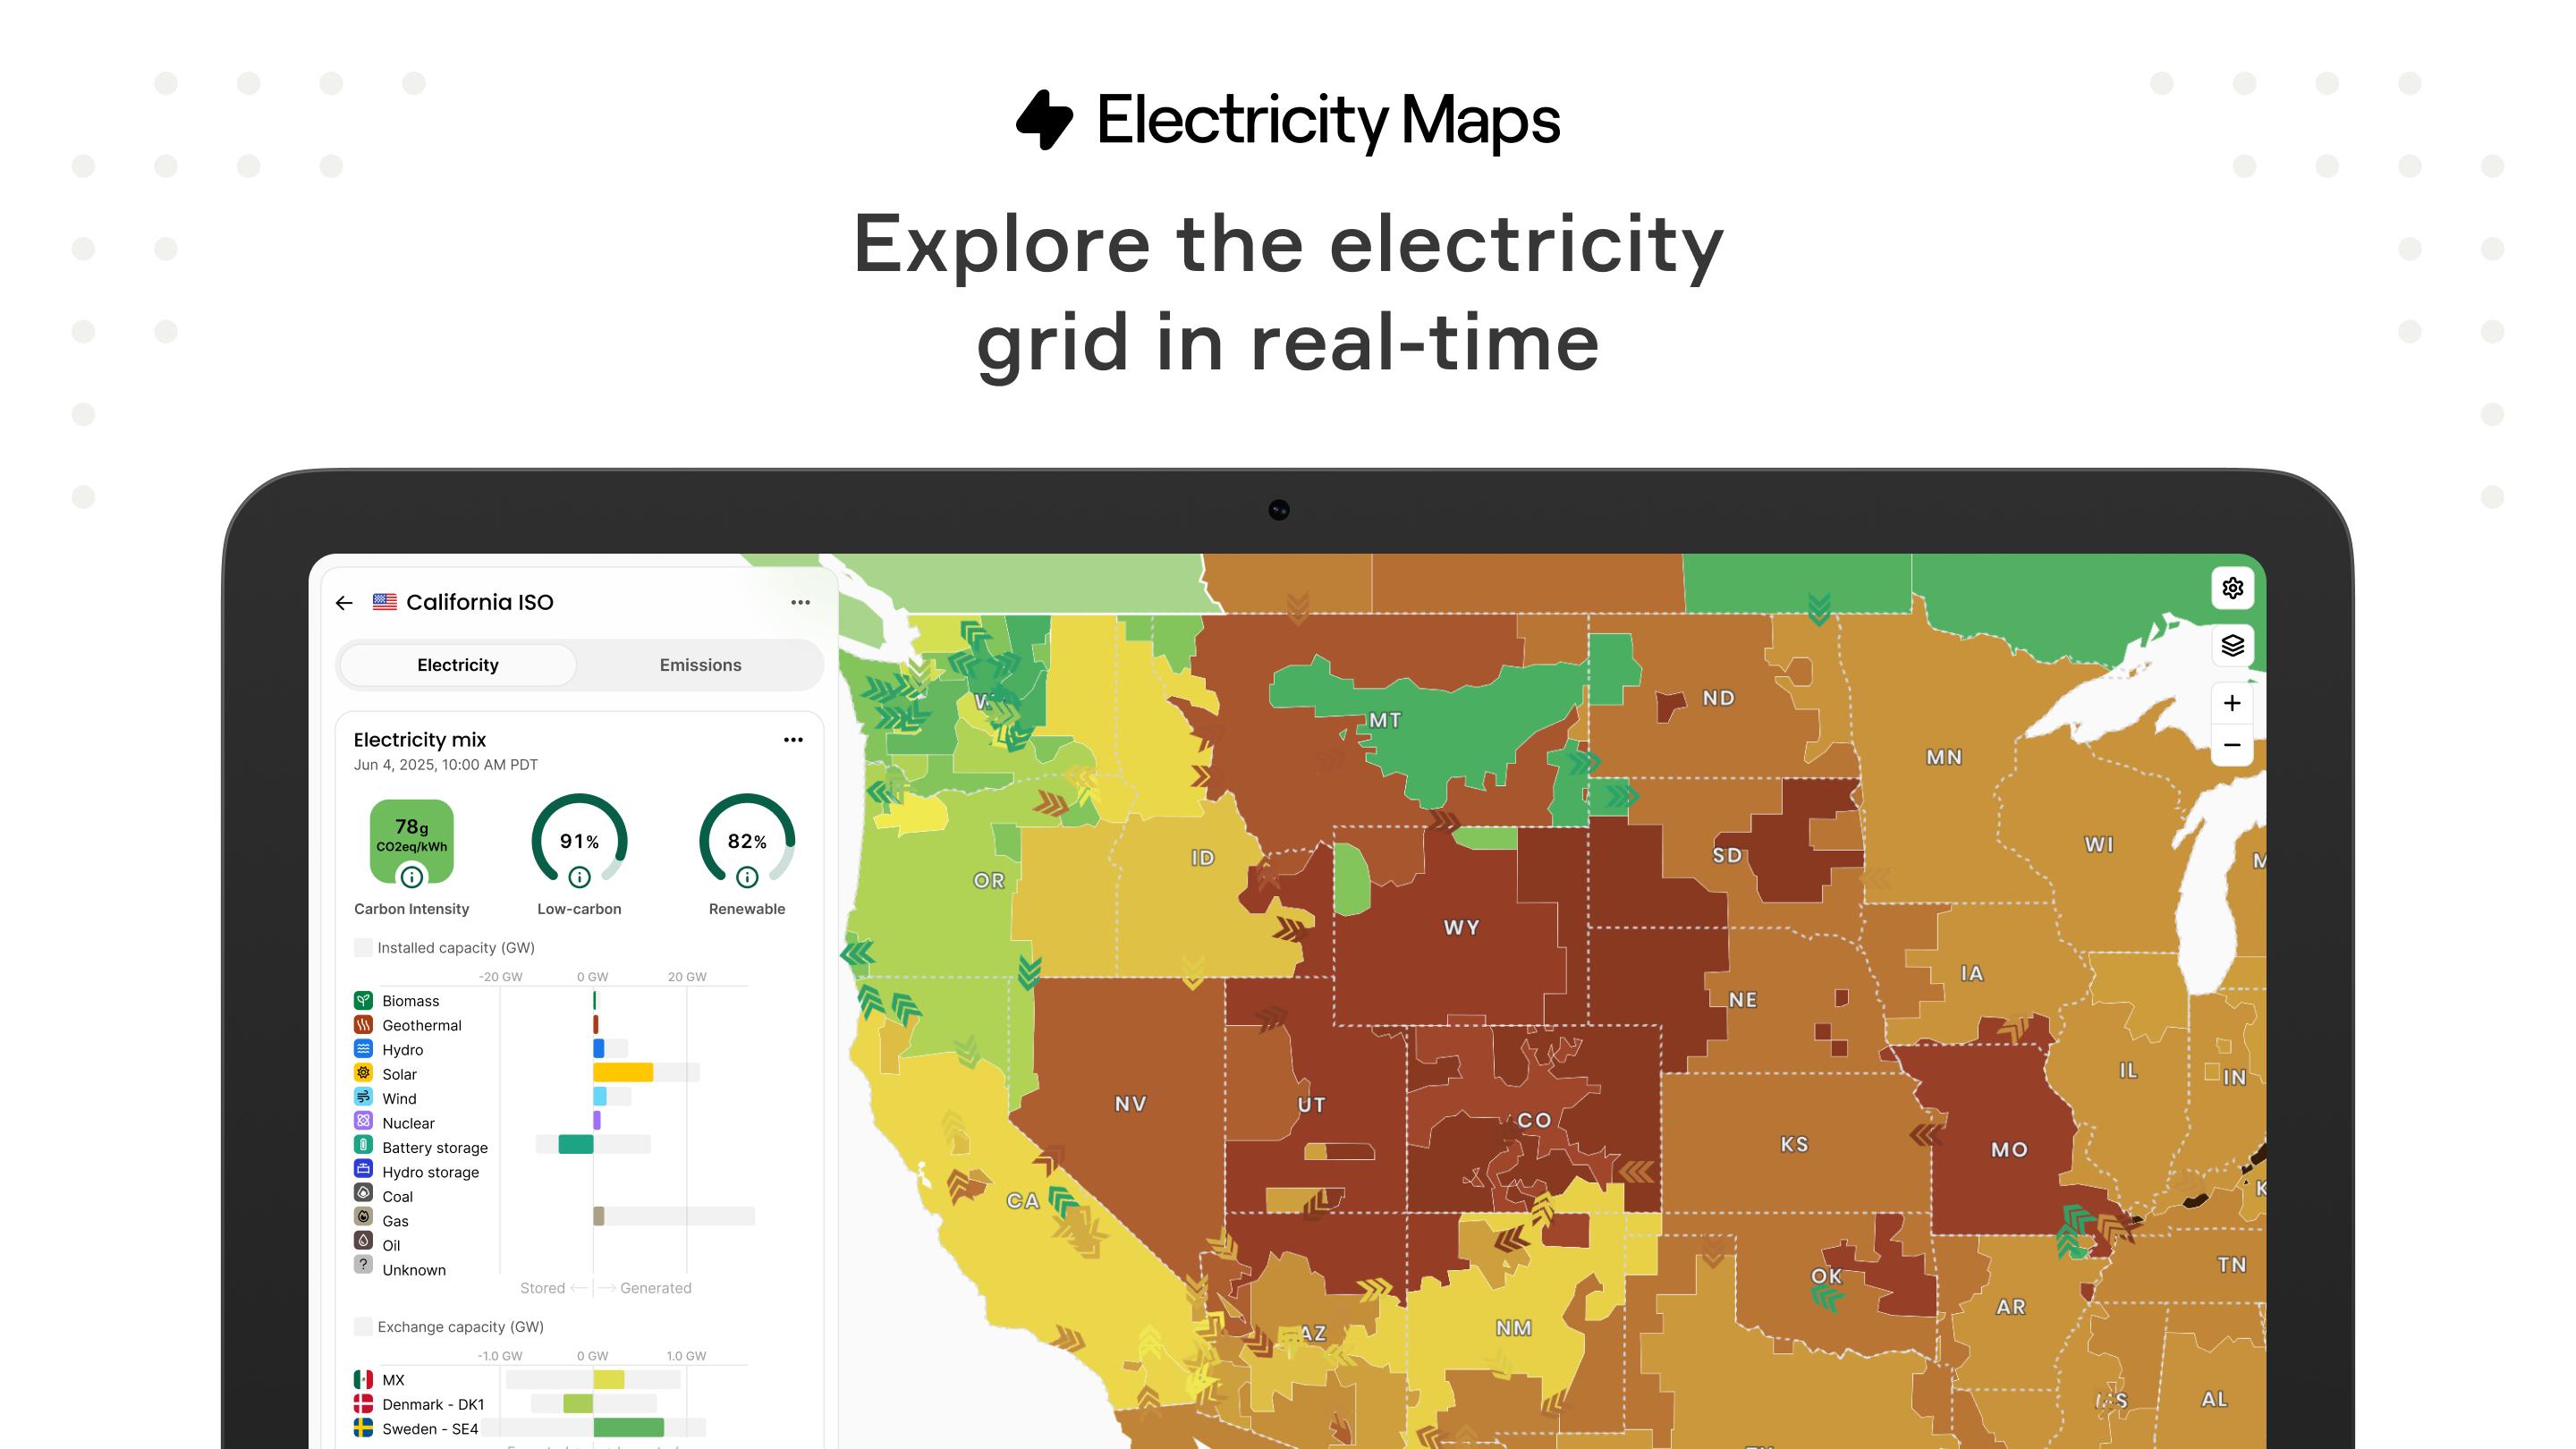
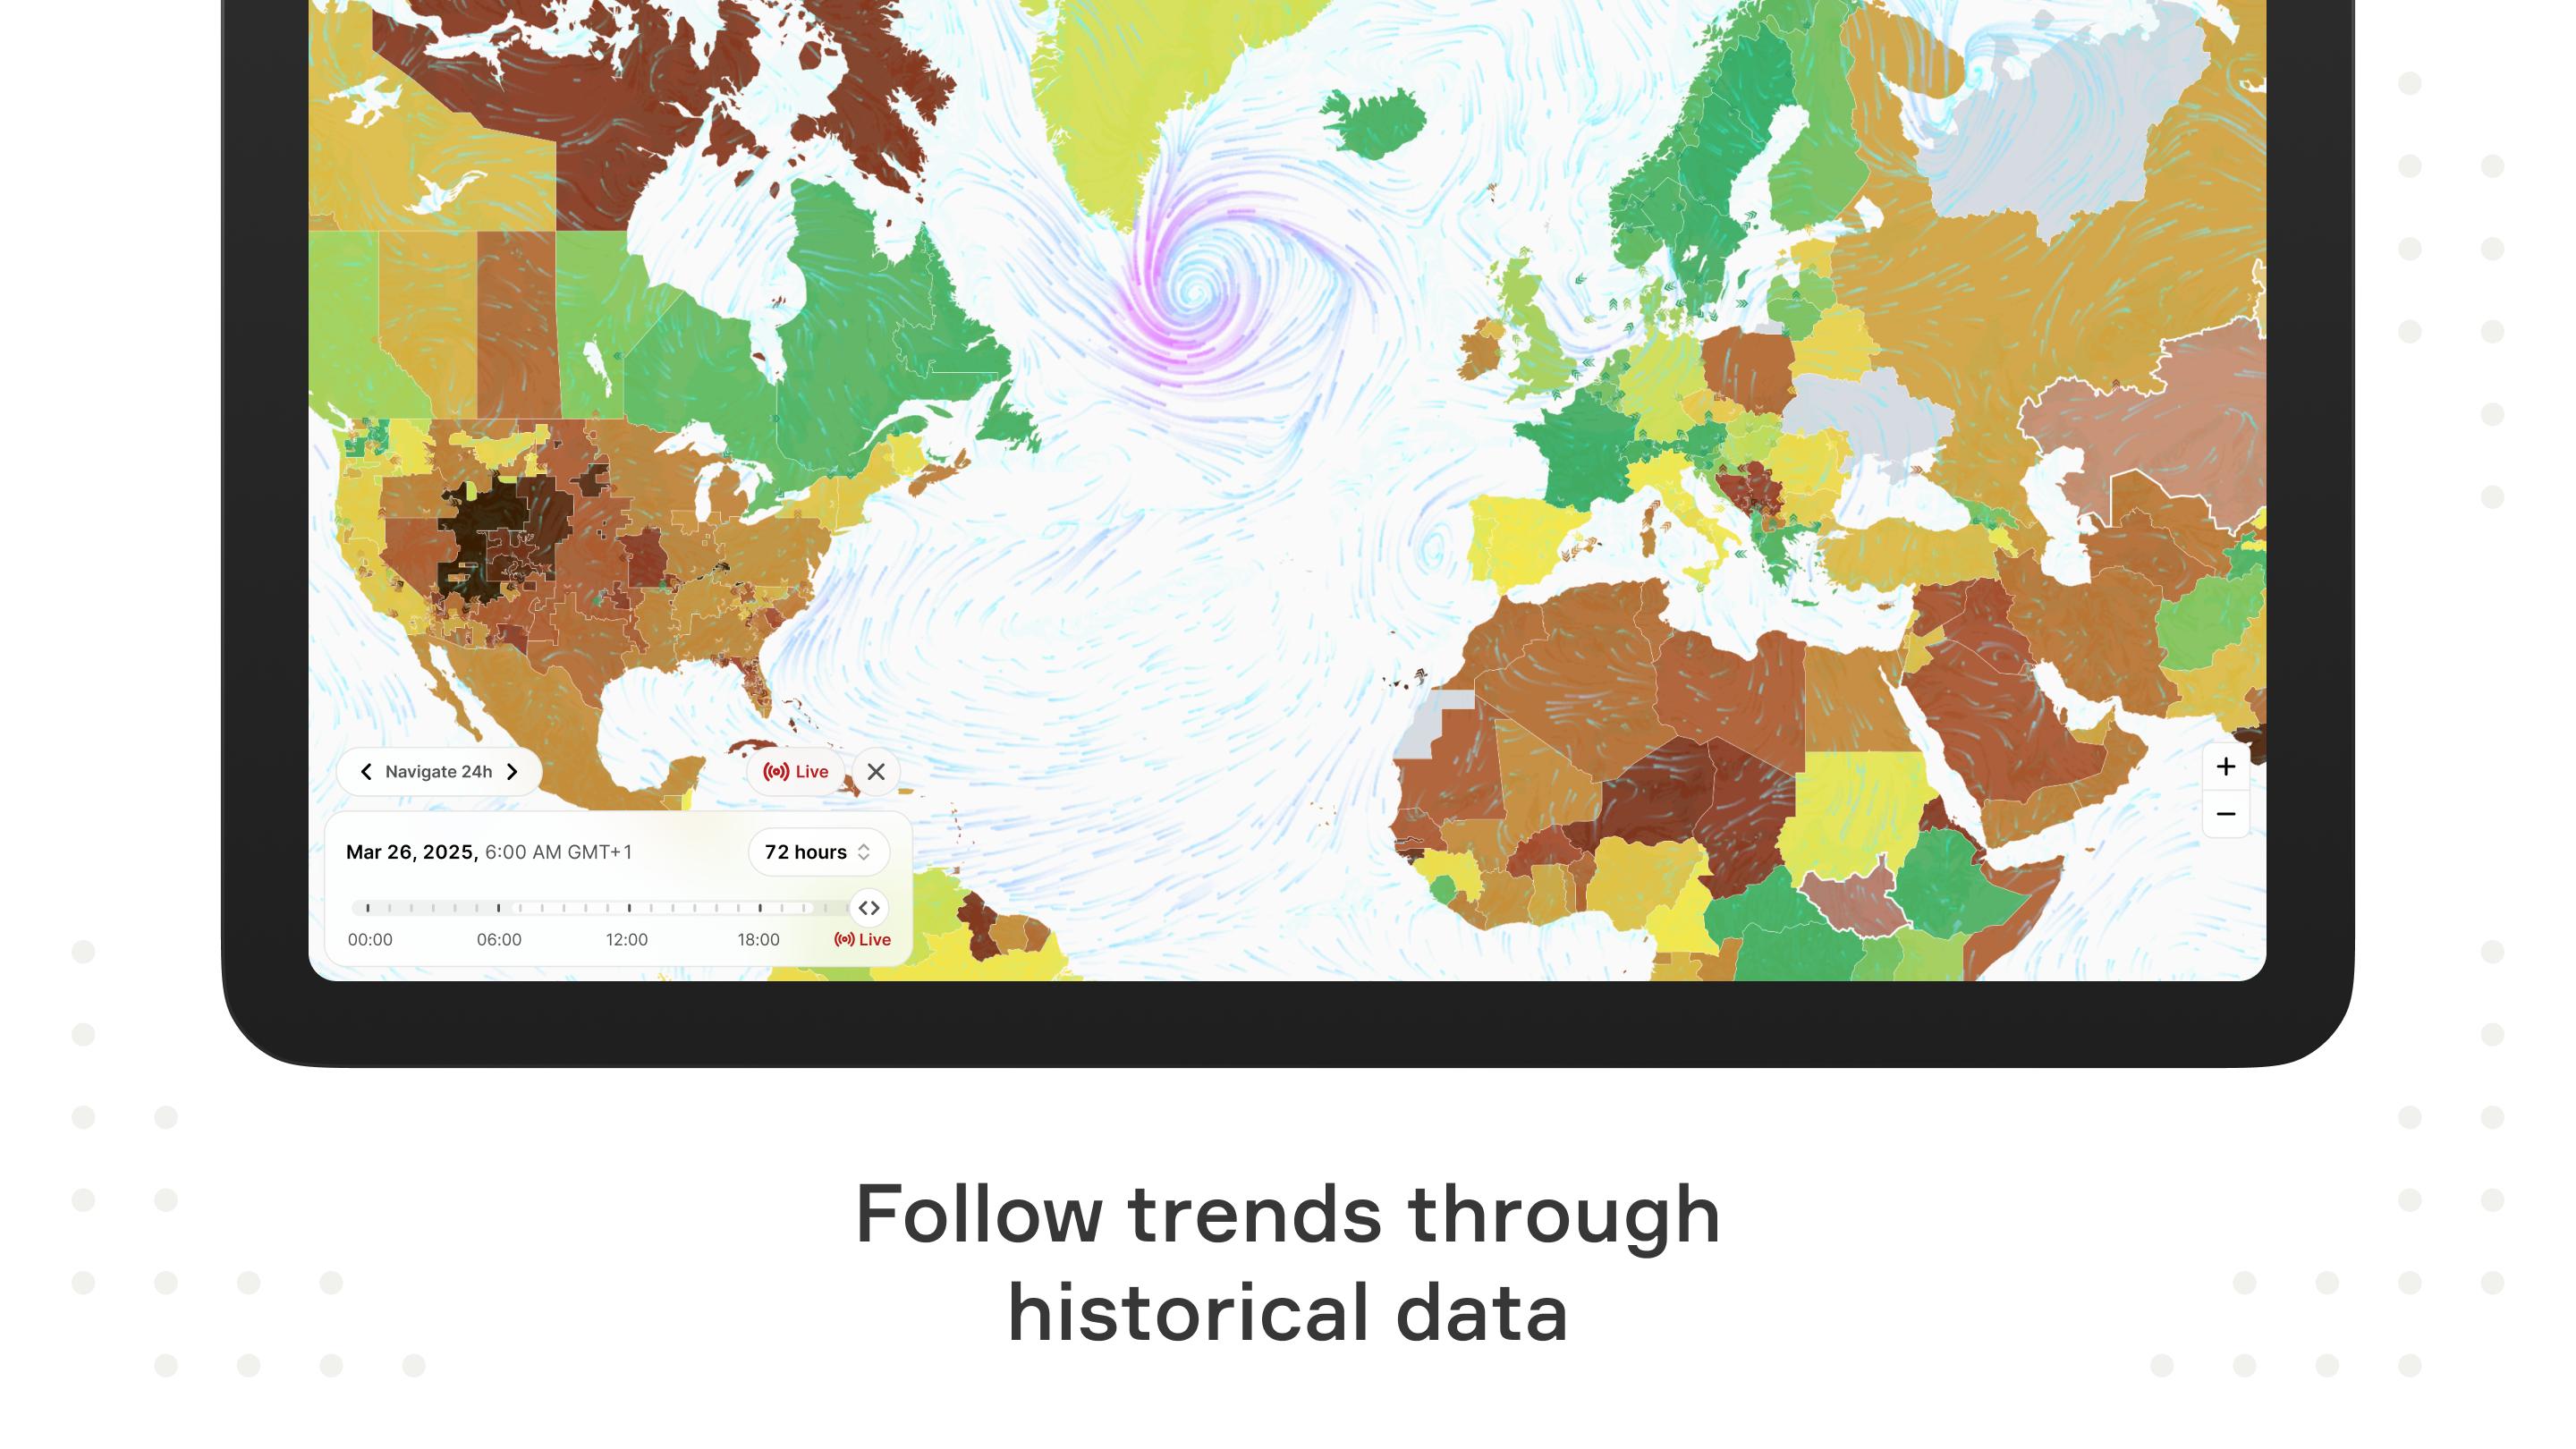
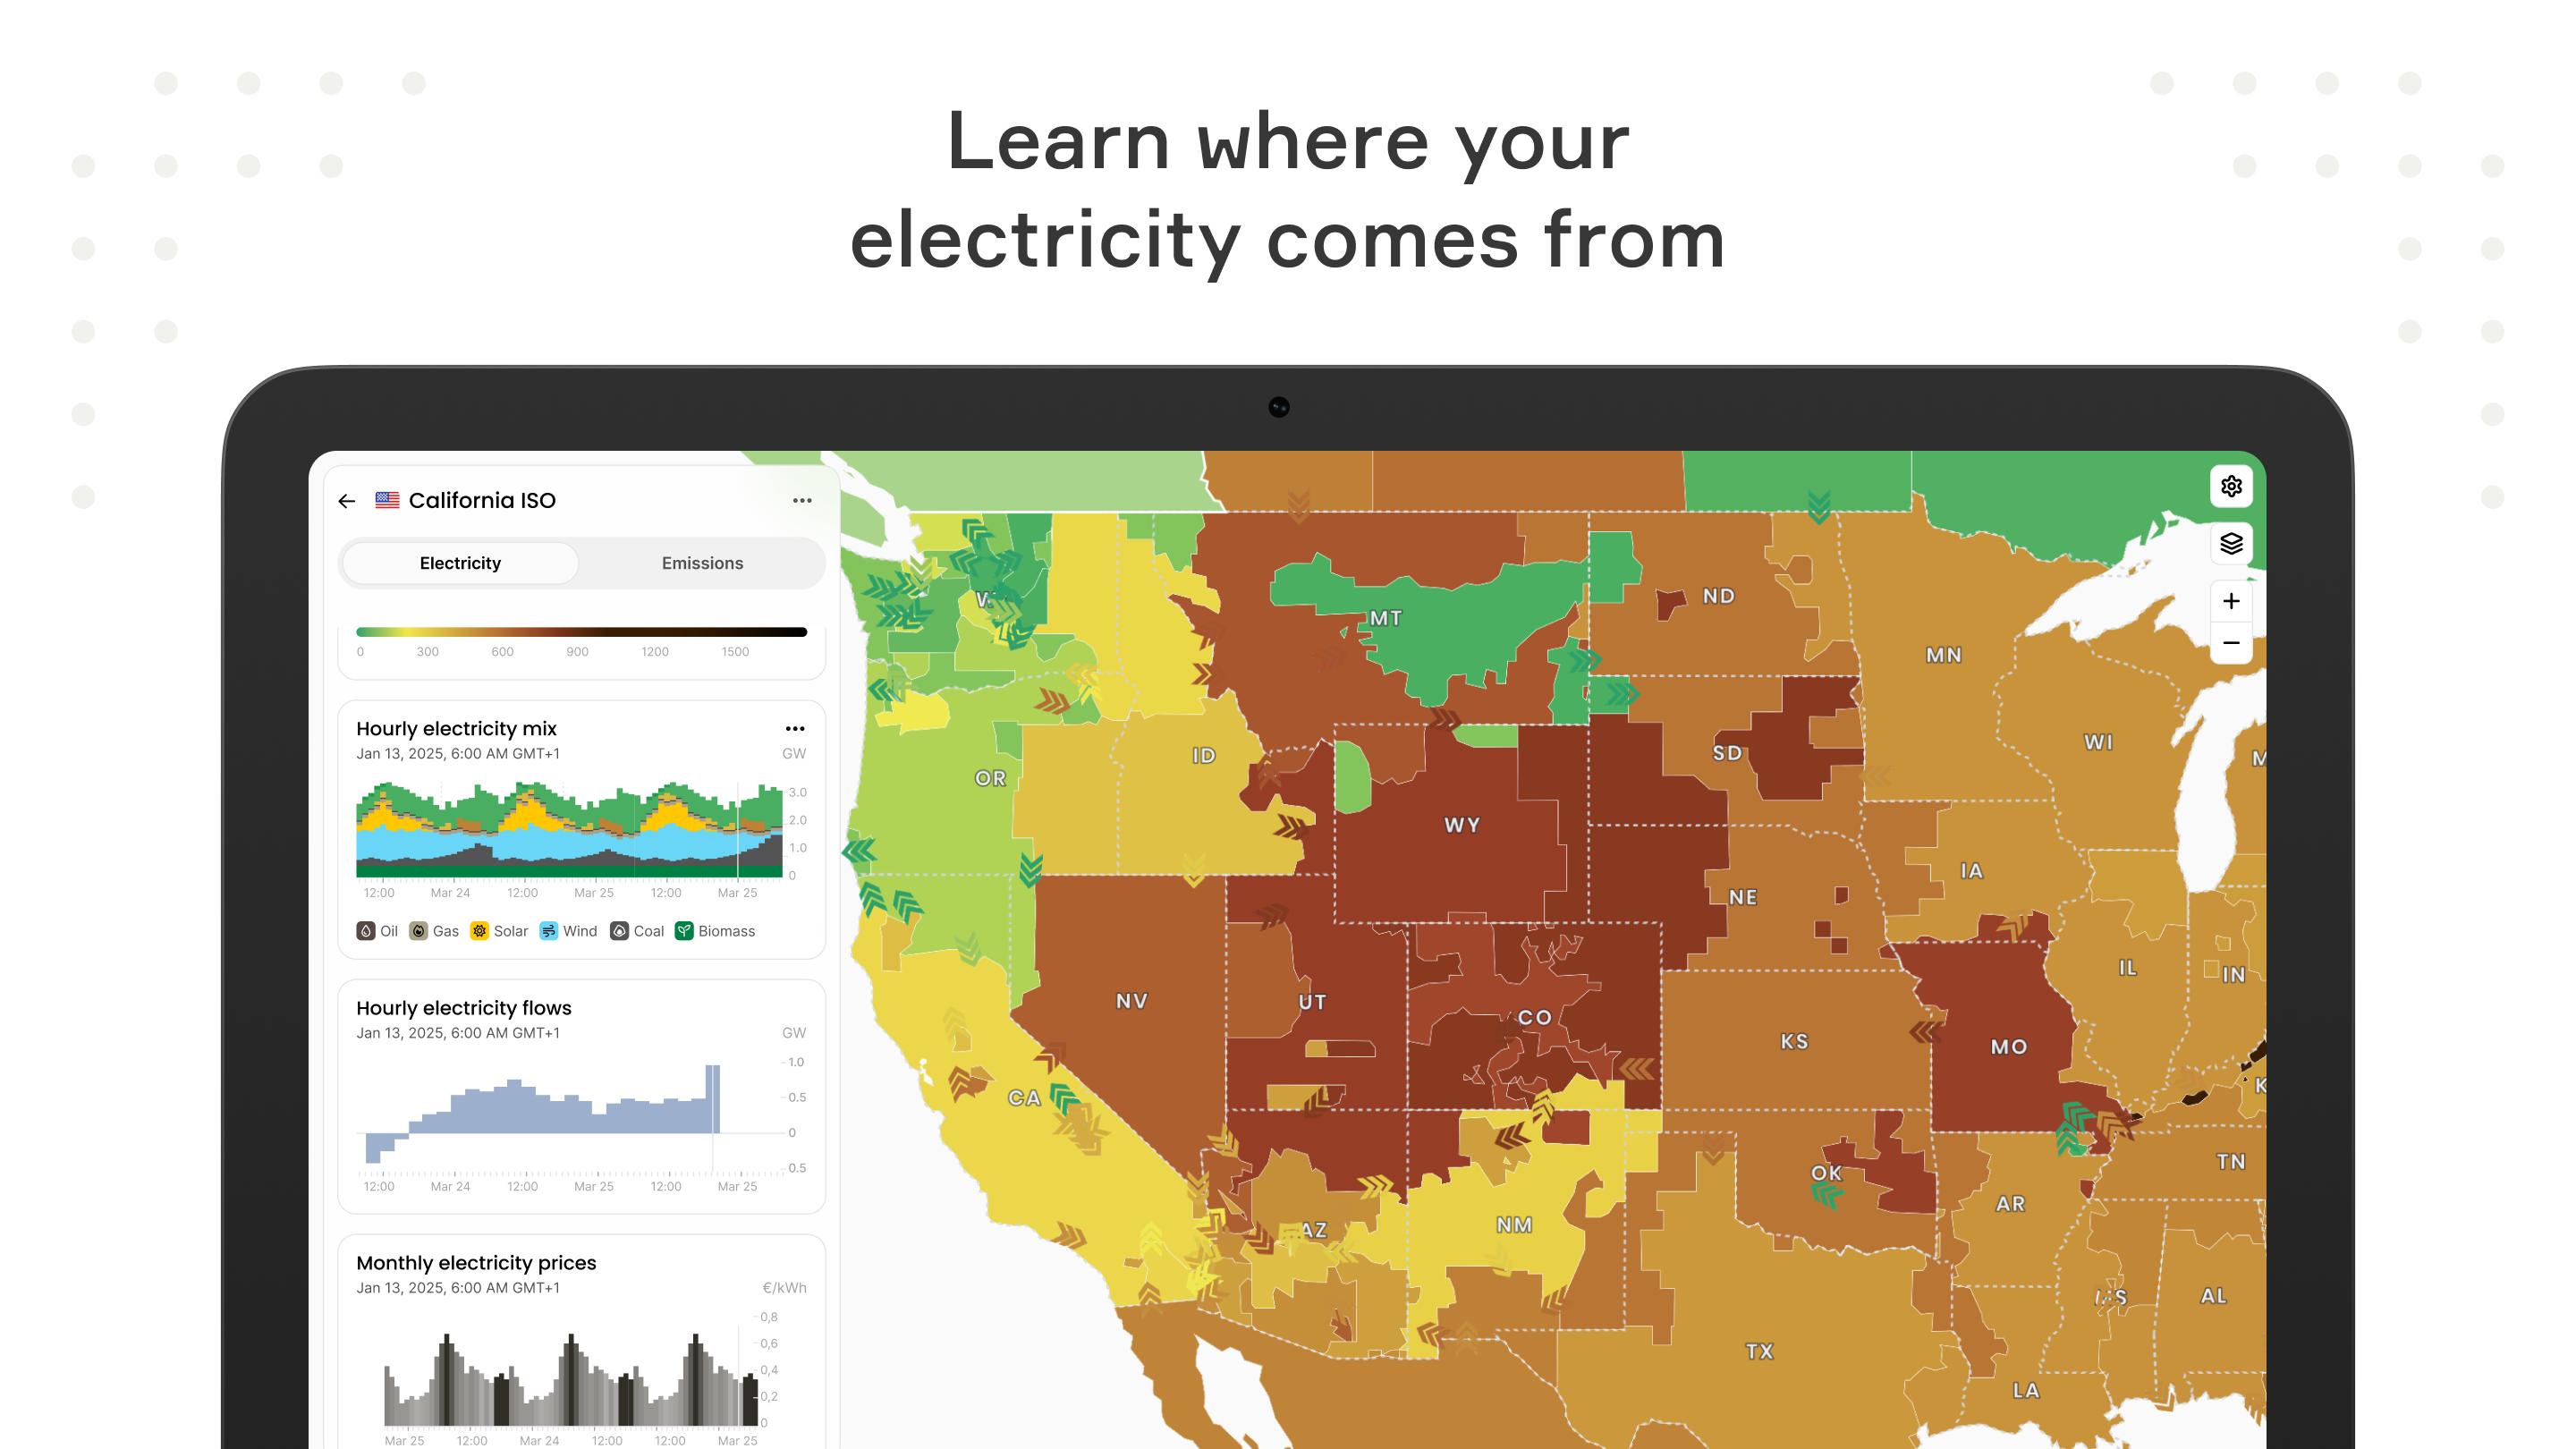
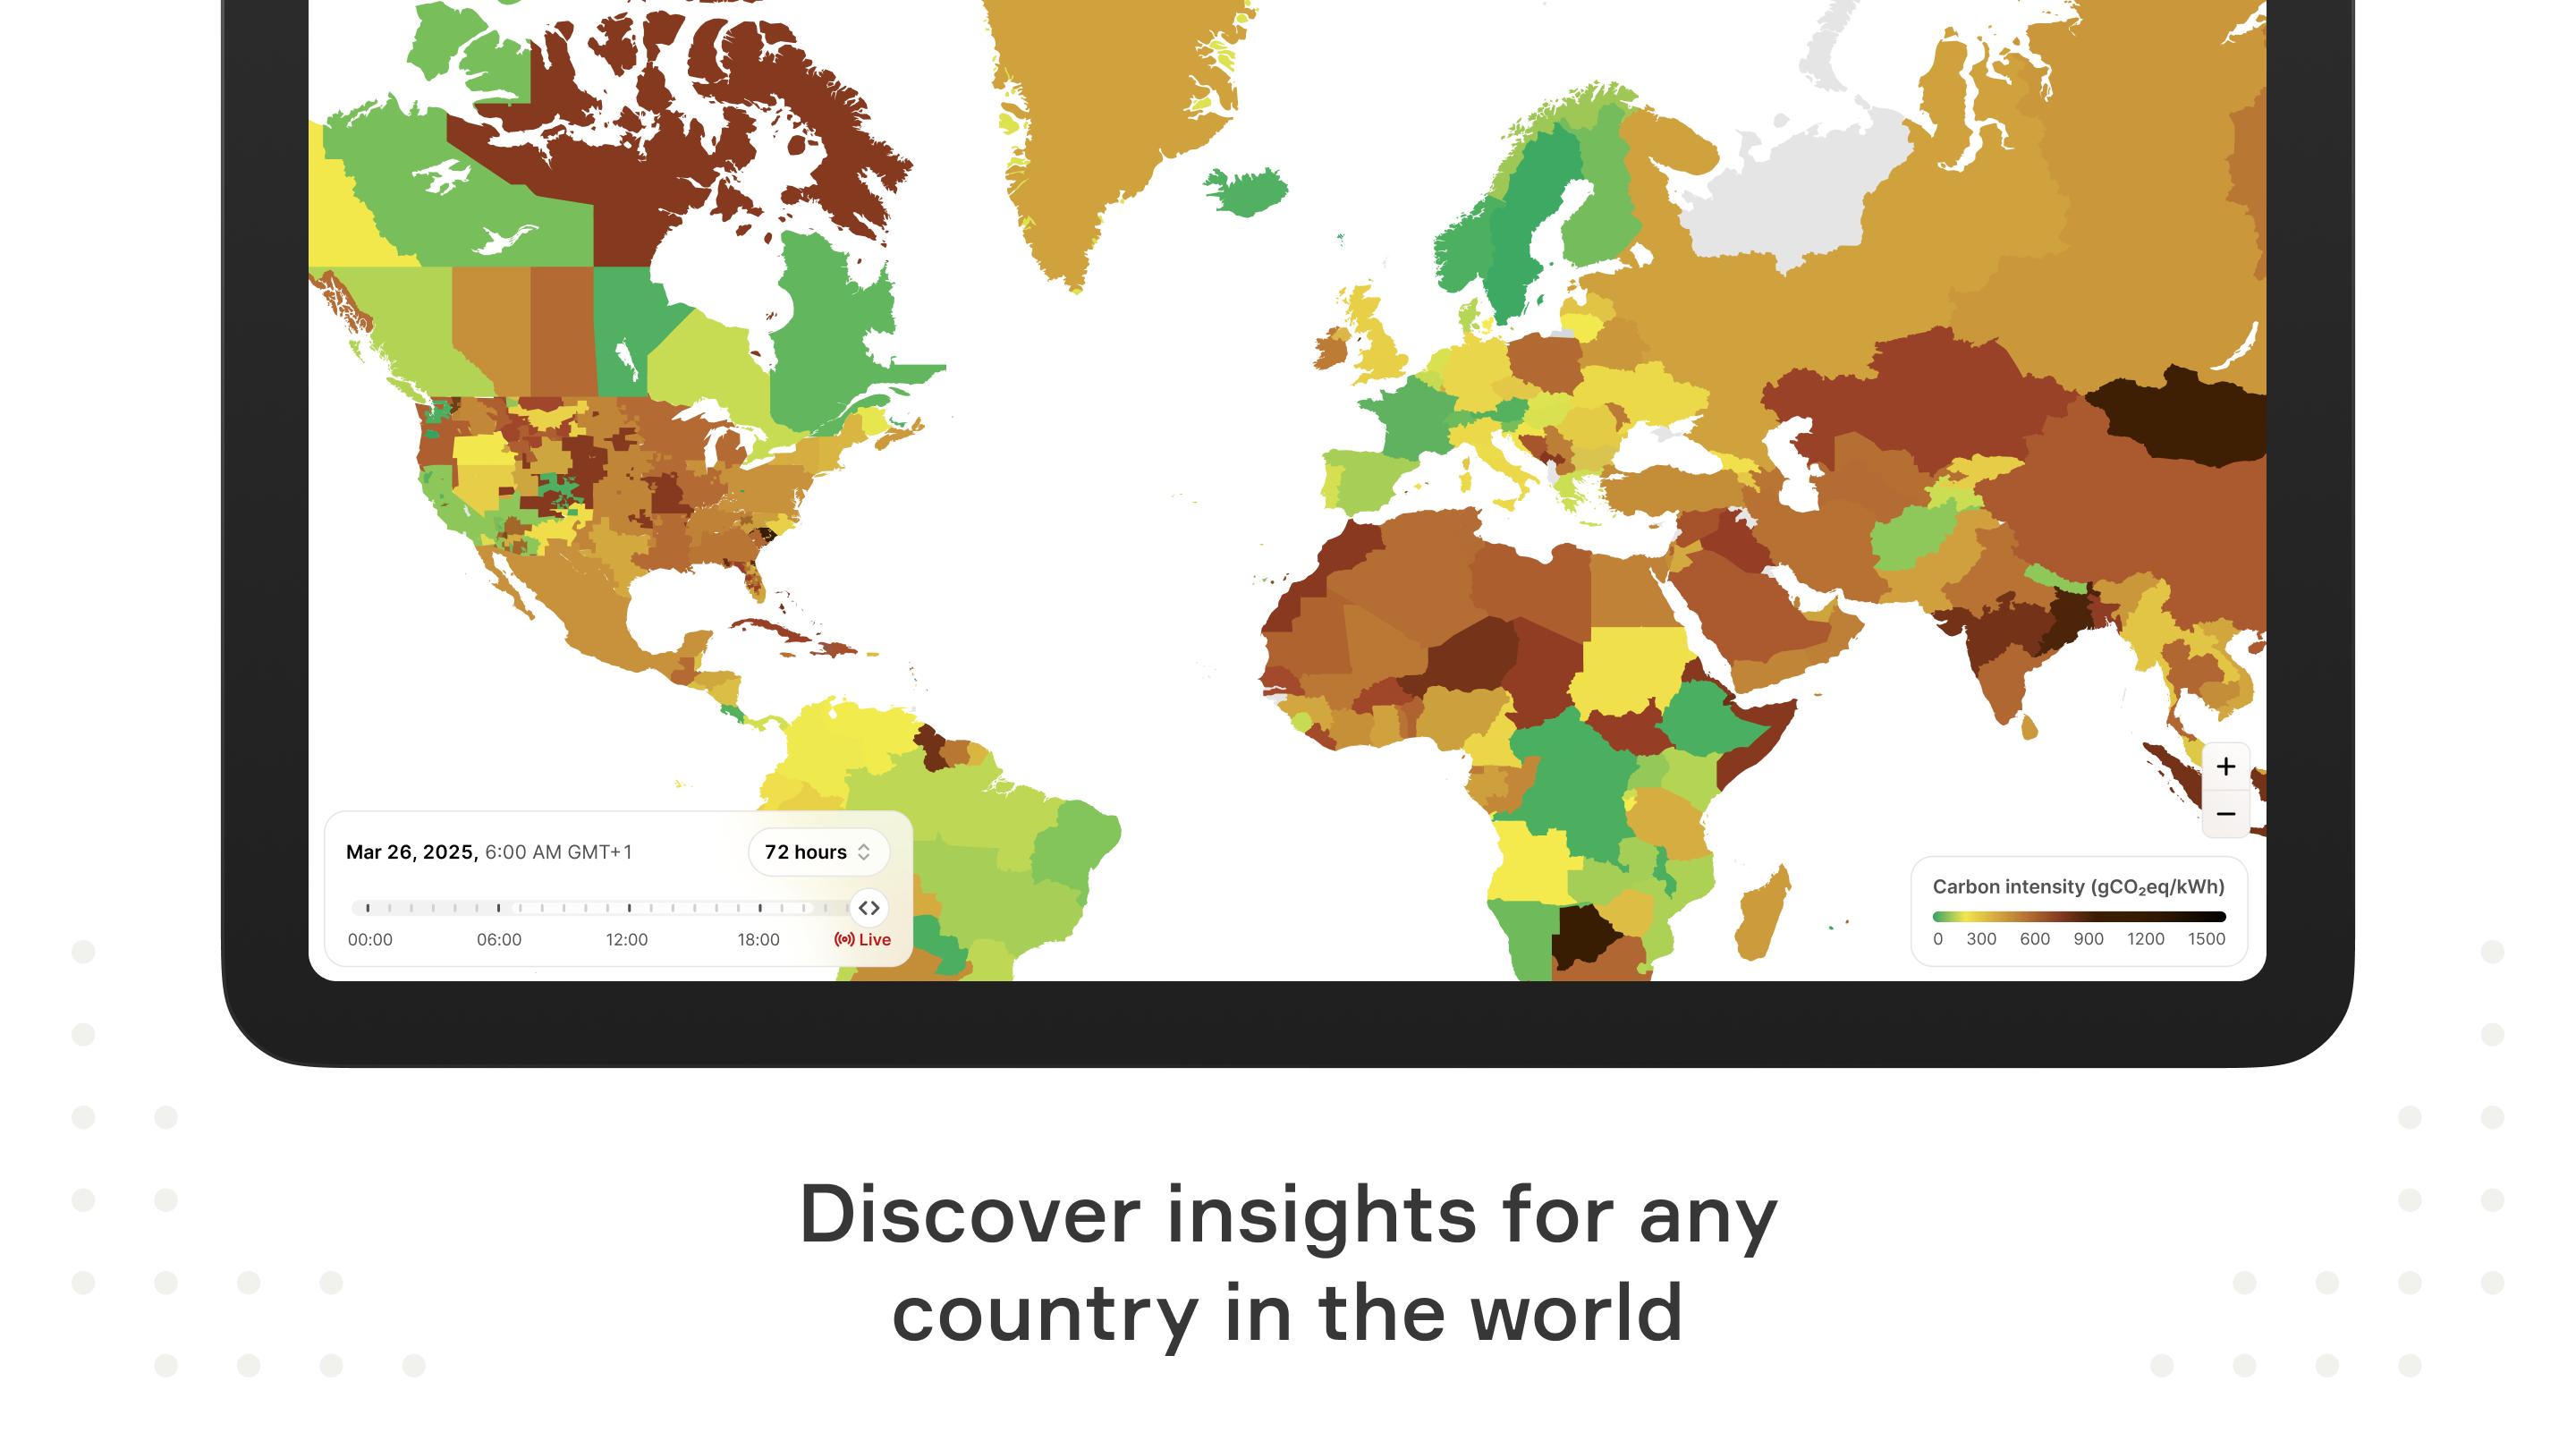
世界中のリアルタイムおよび過去の電力データを探索
生産ミックスと CO2 排出量から価格、再生可能エネルギーなどに至るまで、世界中のリアルタイムおよび過去の電力データを探索します。Last updated on 2025年08月31日
We’ve crunched the numbers (every 5 minutes, to be exact) so you don’t have to. Now you can discover energy data insights in even greater detail in our new 5-minute granularity view!
We’re also introducing real-time grid alerts, so if the grid’s feeling spicy, you’ll be the first to know.
最終のバージョン
![]() 1.289.5
1.289.5
投稿者
Máđąnī Mirage Ytb
Android 要件
Android 6.0+
Available on
![]()
カテゴリー
報告
Discover what you want easier, faster and safer.

Electricity Maps
1.289.5 by Electricity Maps
2025年08月31日